Done-for-you Klaviyo setup. 8 flows. 28–33 emails. One-time payment.
No ongoing fees. Full refund if we don't beat your old flows within 30 days.
Once you solve acquisition and scale spend… you hit bottleneck #2.
Rising CAC.
When you scale ad spend, ROAS decreases.
Margins compress. MER suffers.
Most brands respond by spending more money.
But the cause of the problem isn't your ads.
The cause is that your audience is rented.
Everyone is bidding for the same audience on Meta.
Meta owns your audience.
You don't.
Every day you stop paying, your traffic disappears.
Which means every month you're forced to buy the same customers again.
Meanwhile acquisition gets more expensive.
Competition increases.
Your margins slowly get squeezed.
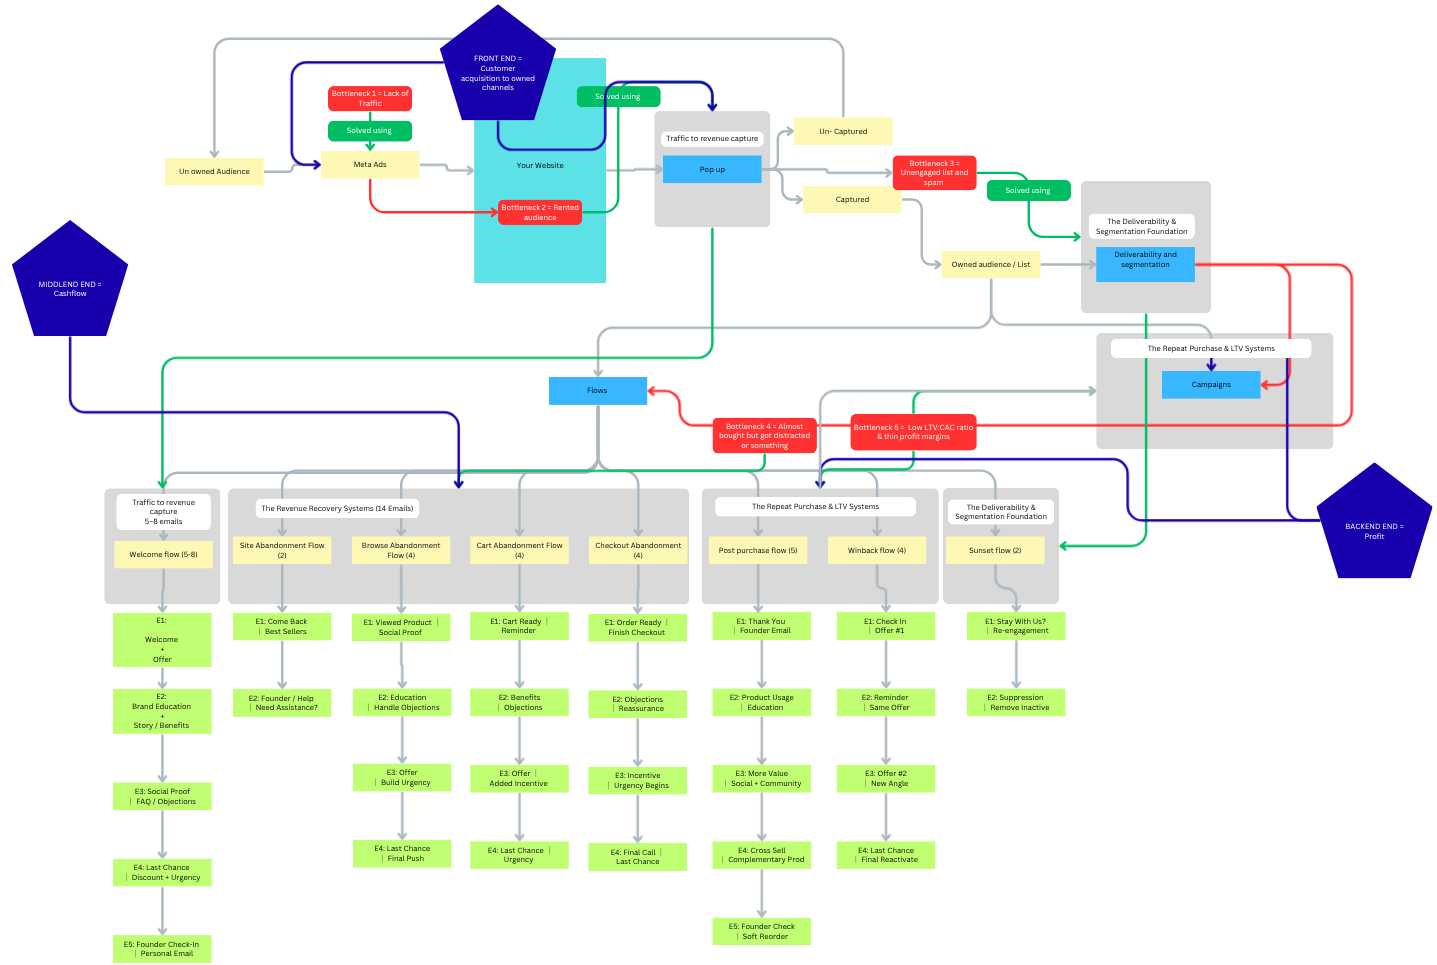
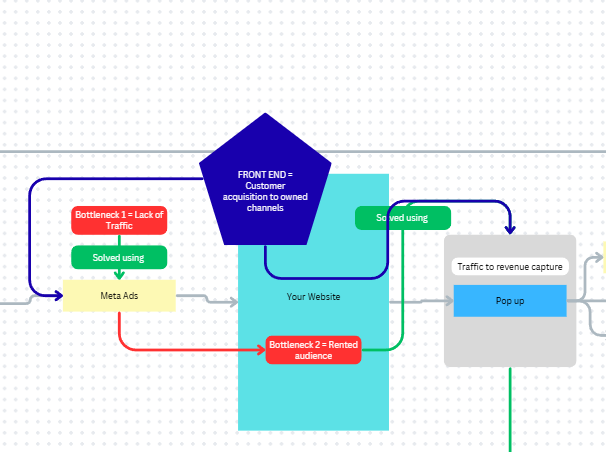
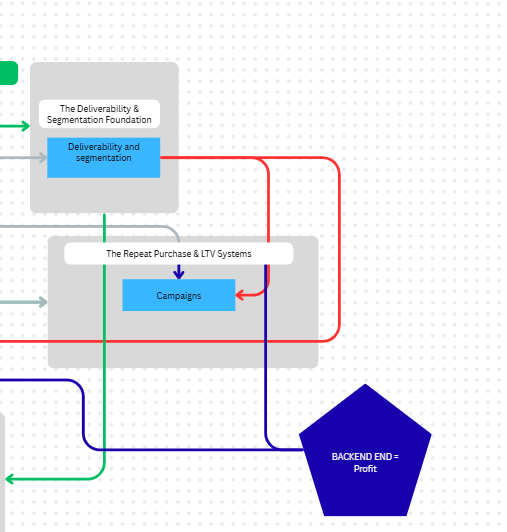
Every business divides into three parts.
The way out isn't better ads. It's owning your audience.
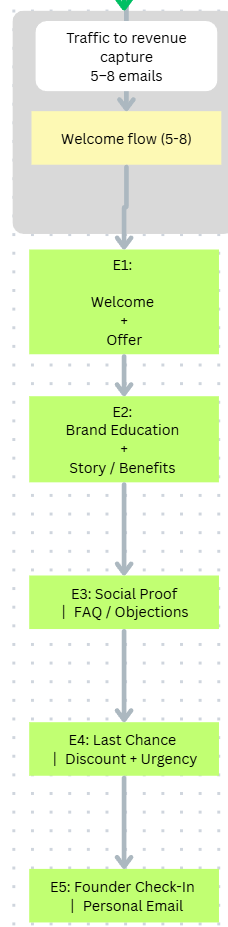
View full funnel diagram →Popups. Welcome flows. Owned audience.
Meta ads. Popups. Welcome flows — these all belong to the frontend.
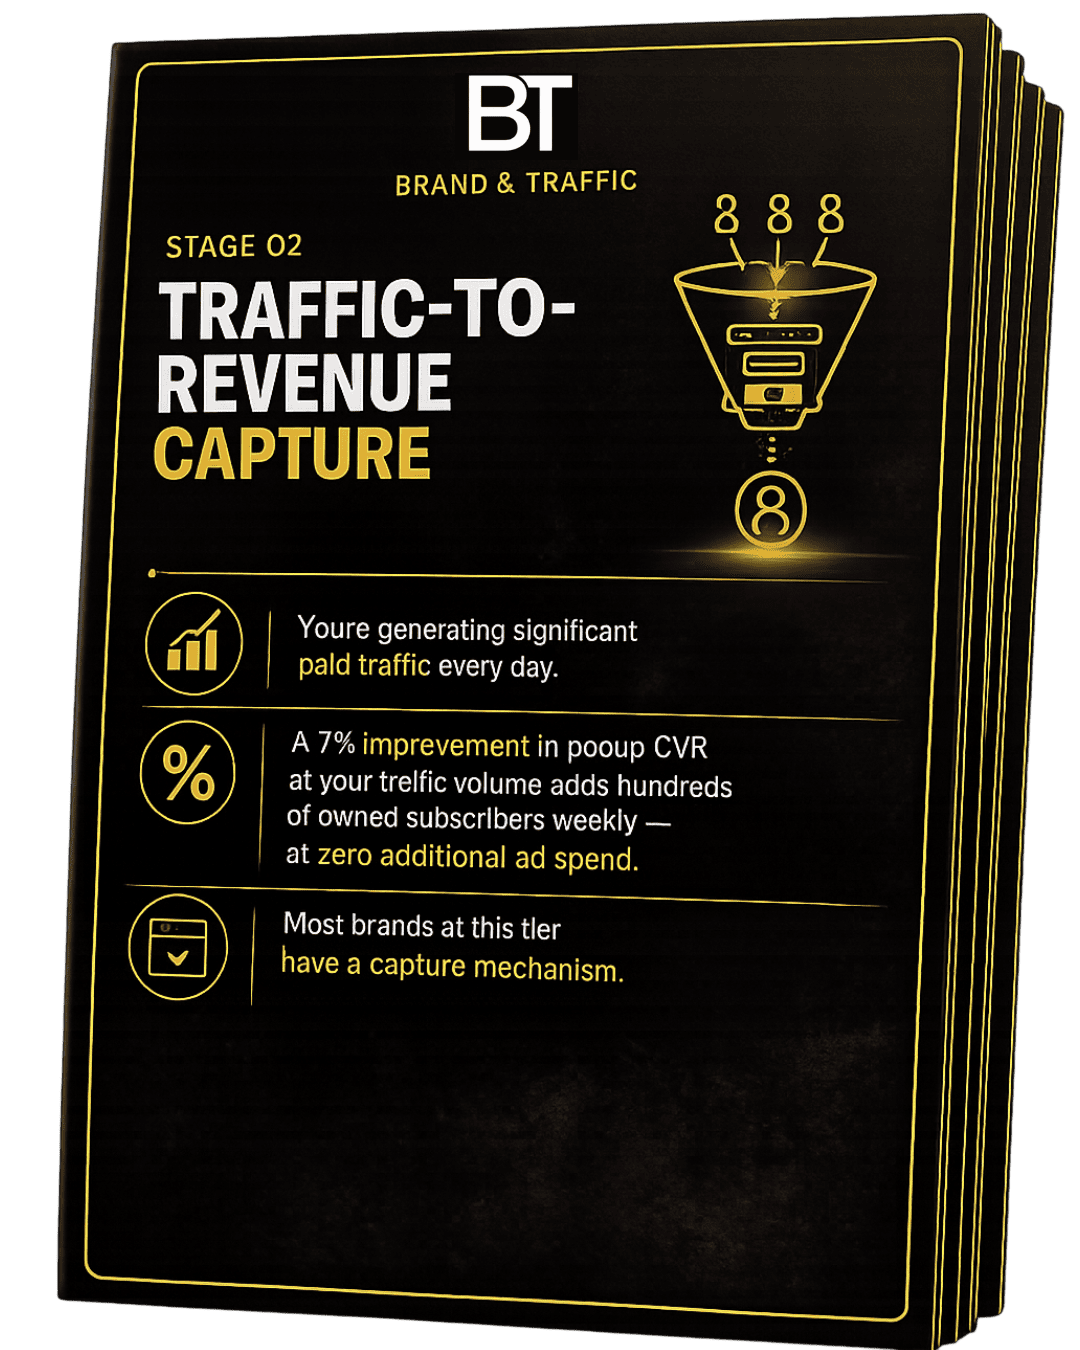
Once acquisition is doing its job, the most important thing becomes owning your audience.
Because every system downstream depends on it.
No owned audience = no welcome flow. No abandoned cart flow. No post-purchase. No win-back.
If popup CVR increases by just 0.5–1%...
Every system downstream improves. Cashflow compounds. Profit compounds.
Before cashflow — protect the system.
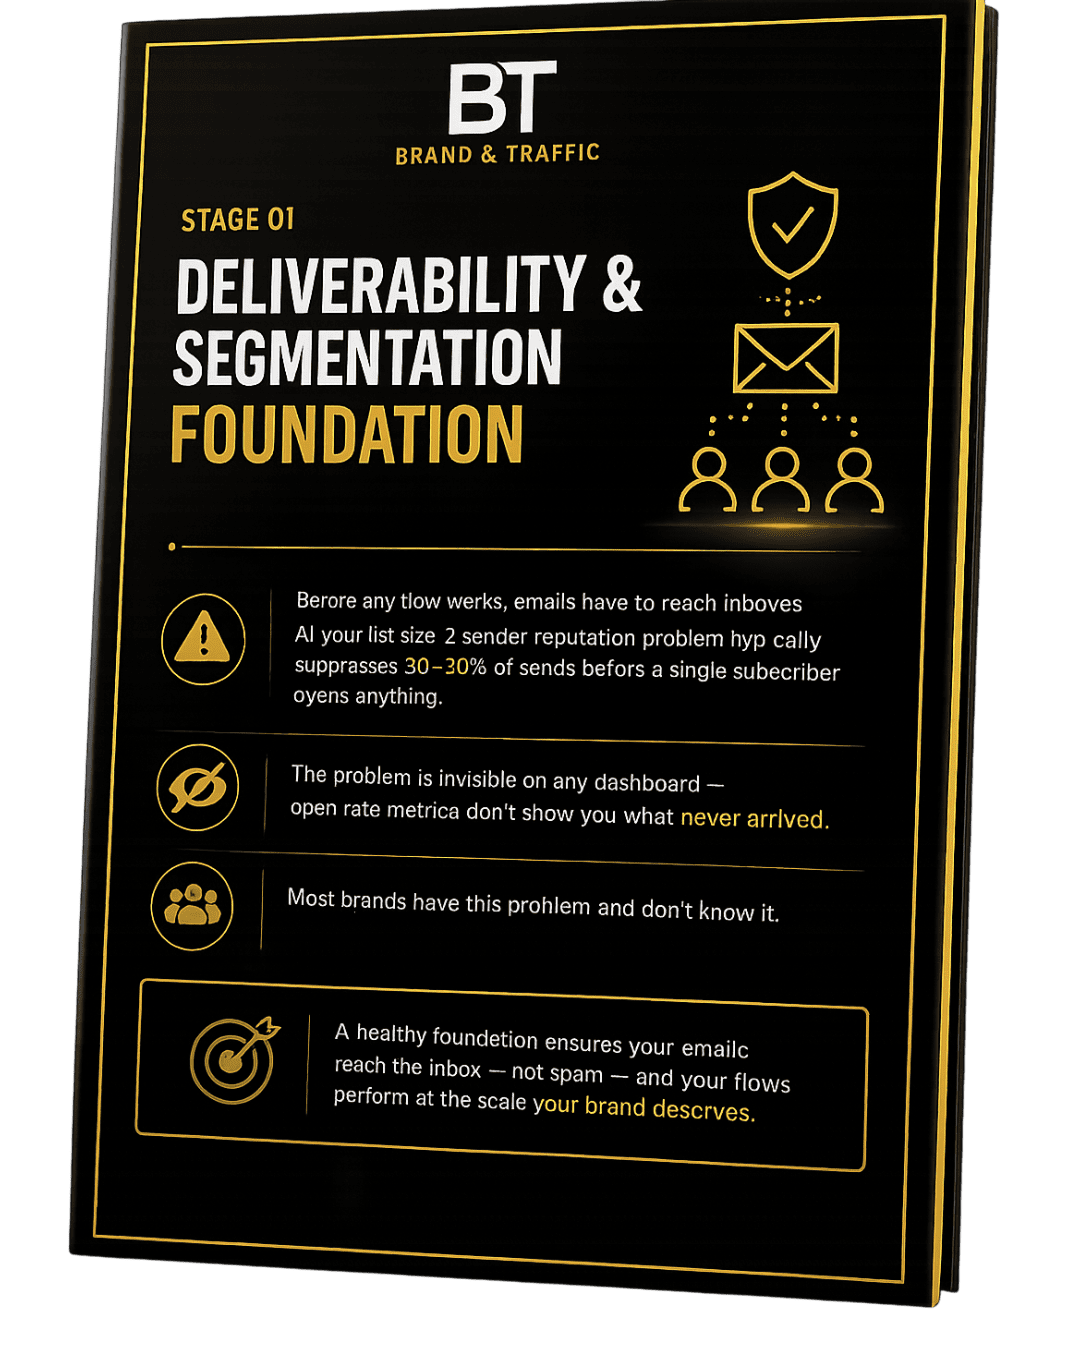
If deliverability isn't built properly, everything downstream suffers.
Unengaged subscribers.
Spam complaints.
Damaged sender reputation.
Poor inbox placement.
It takes twice as long to generate the same cashflow and profit.
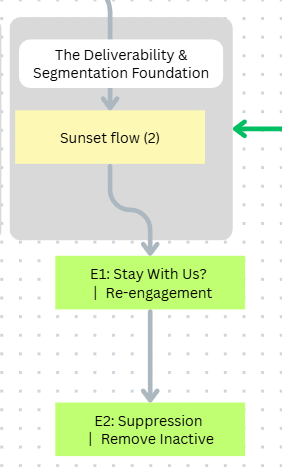
That's why foundations come first.
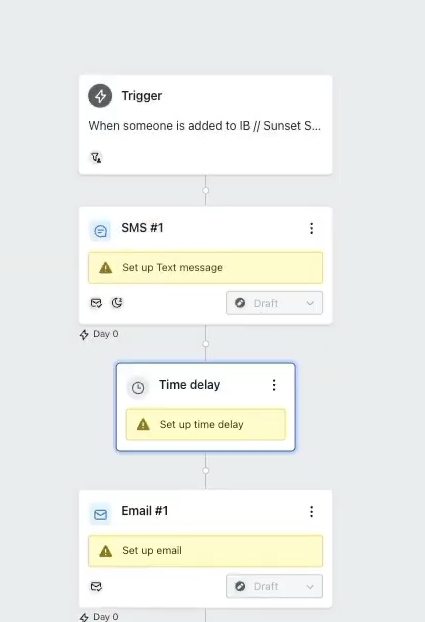
Deliverability. Segmentation. Systematic list cleaning — the sunset flow.
Protecting the system before scaling it.
People wanted to buy. But they didn't.
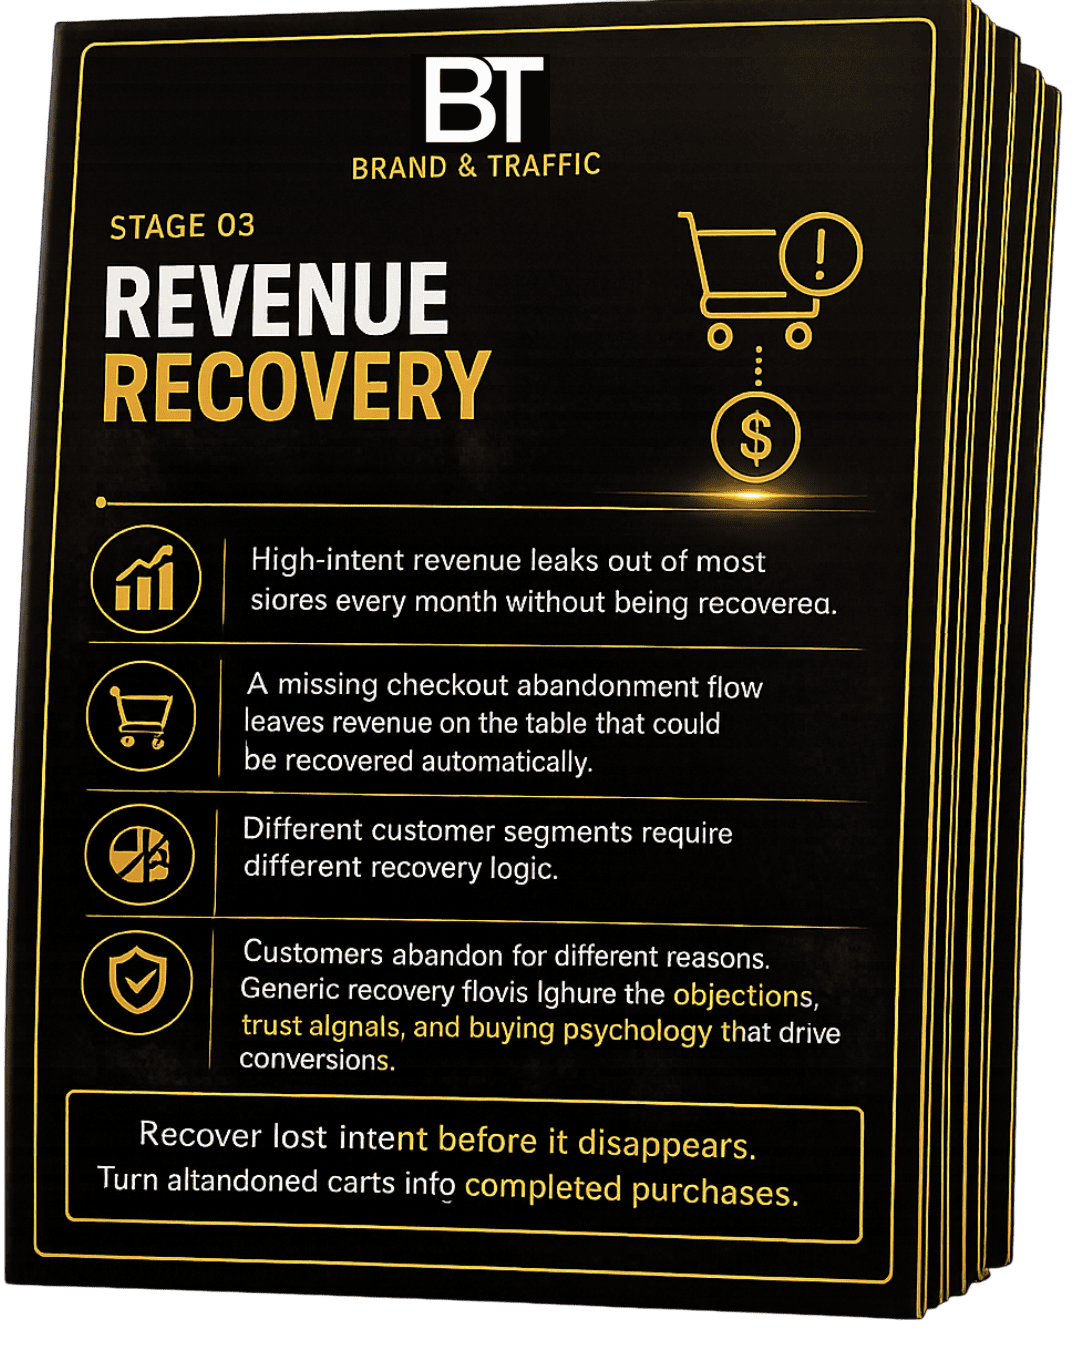
Not because they weren't interested. Because life happened. Distractions.
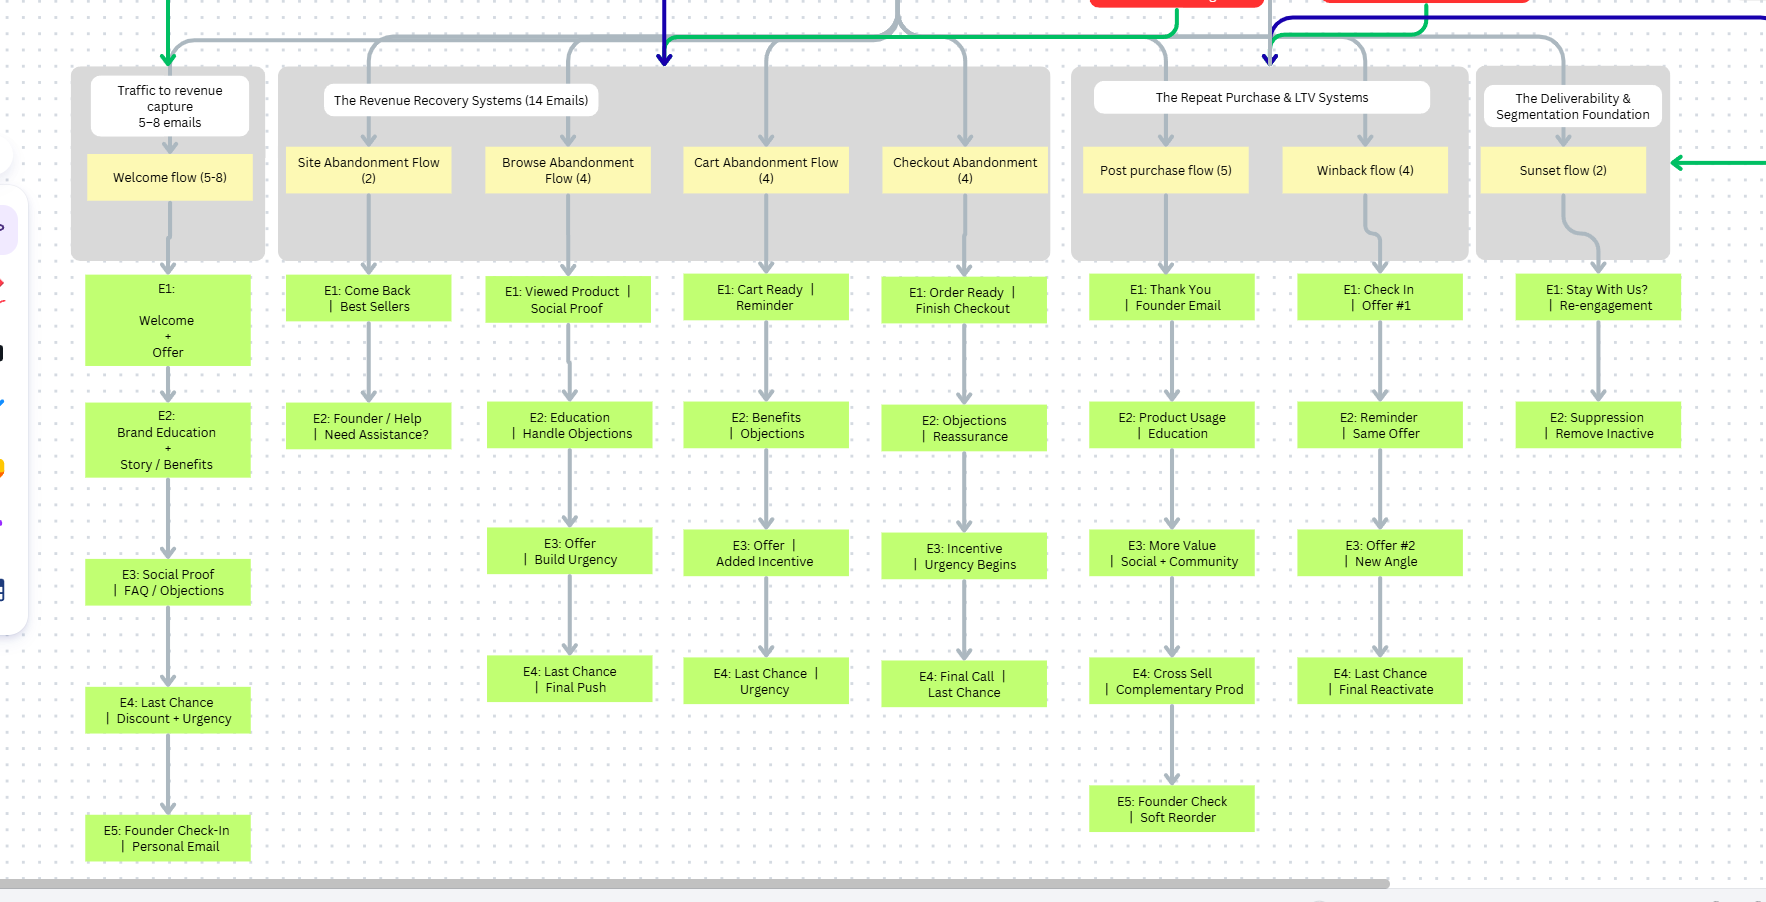
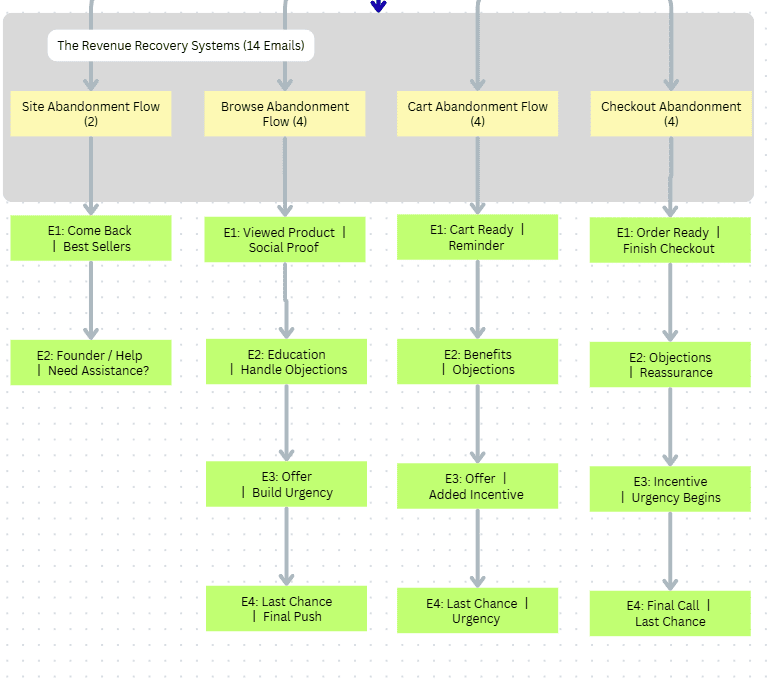
This is where cashflow is created.
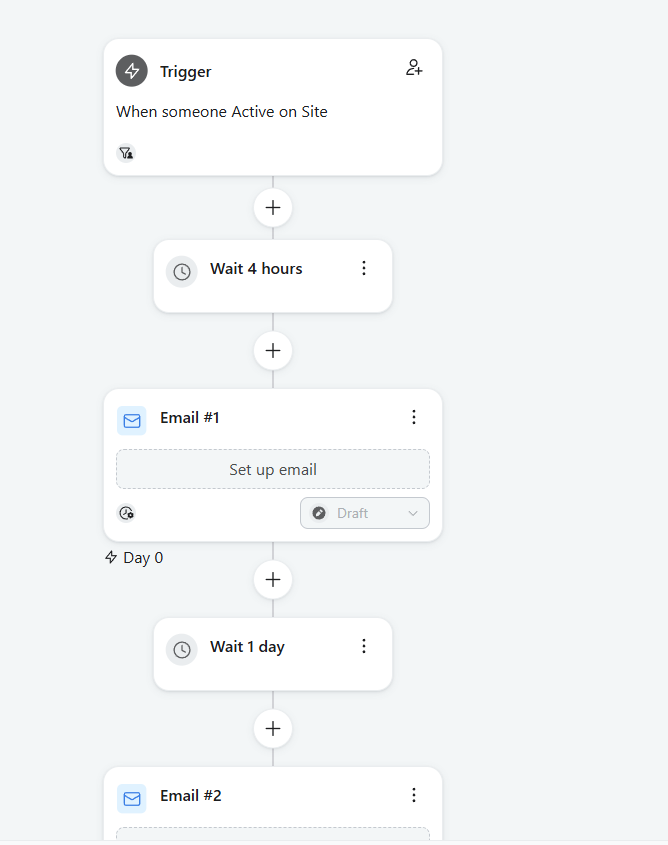
Site abandonment.
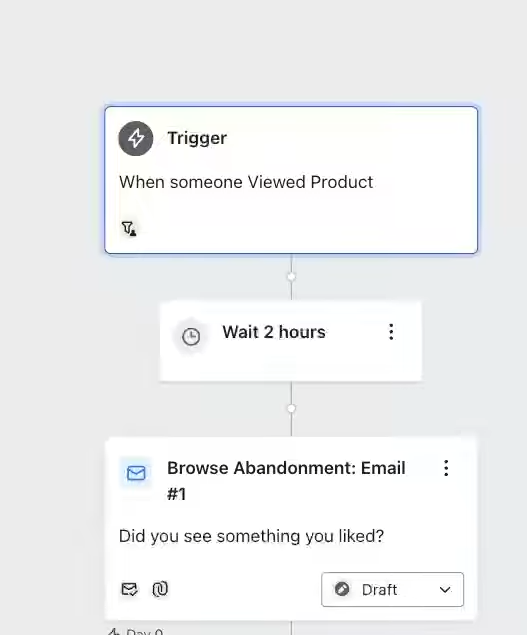
Browse abandonment.
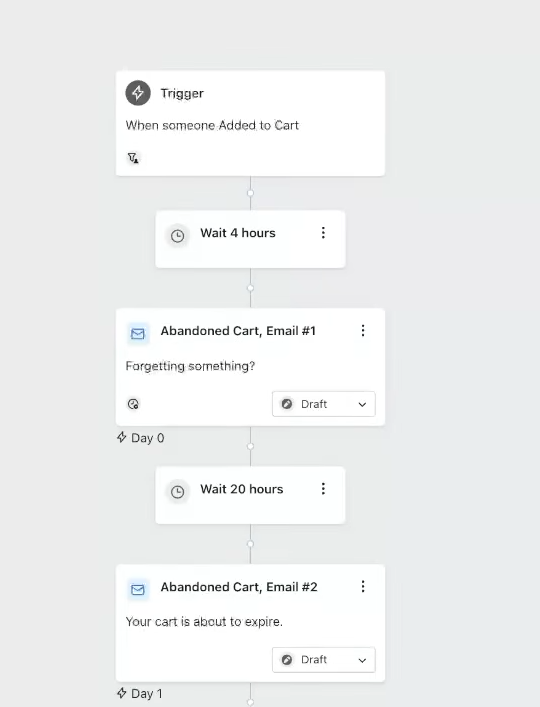
Cart abandonment.
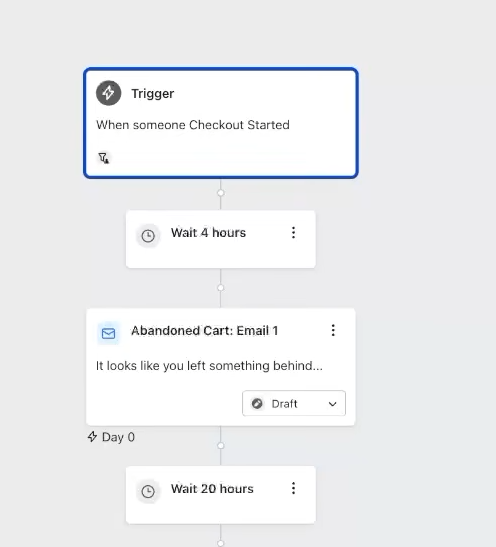
Checkout abandonment.
Four flows. Fourteen emails. All working together to recover revenue that would've otherwise disappeared.
When cashflow improves — customer acquisition becomes easier to scale.
Growth isn't determined by how many customers you acquire. It's how much each one produces.
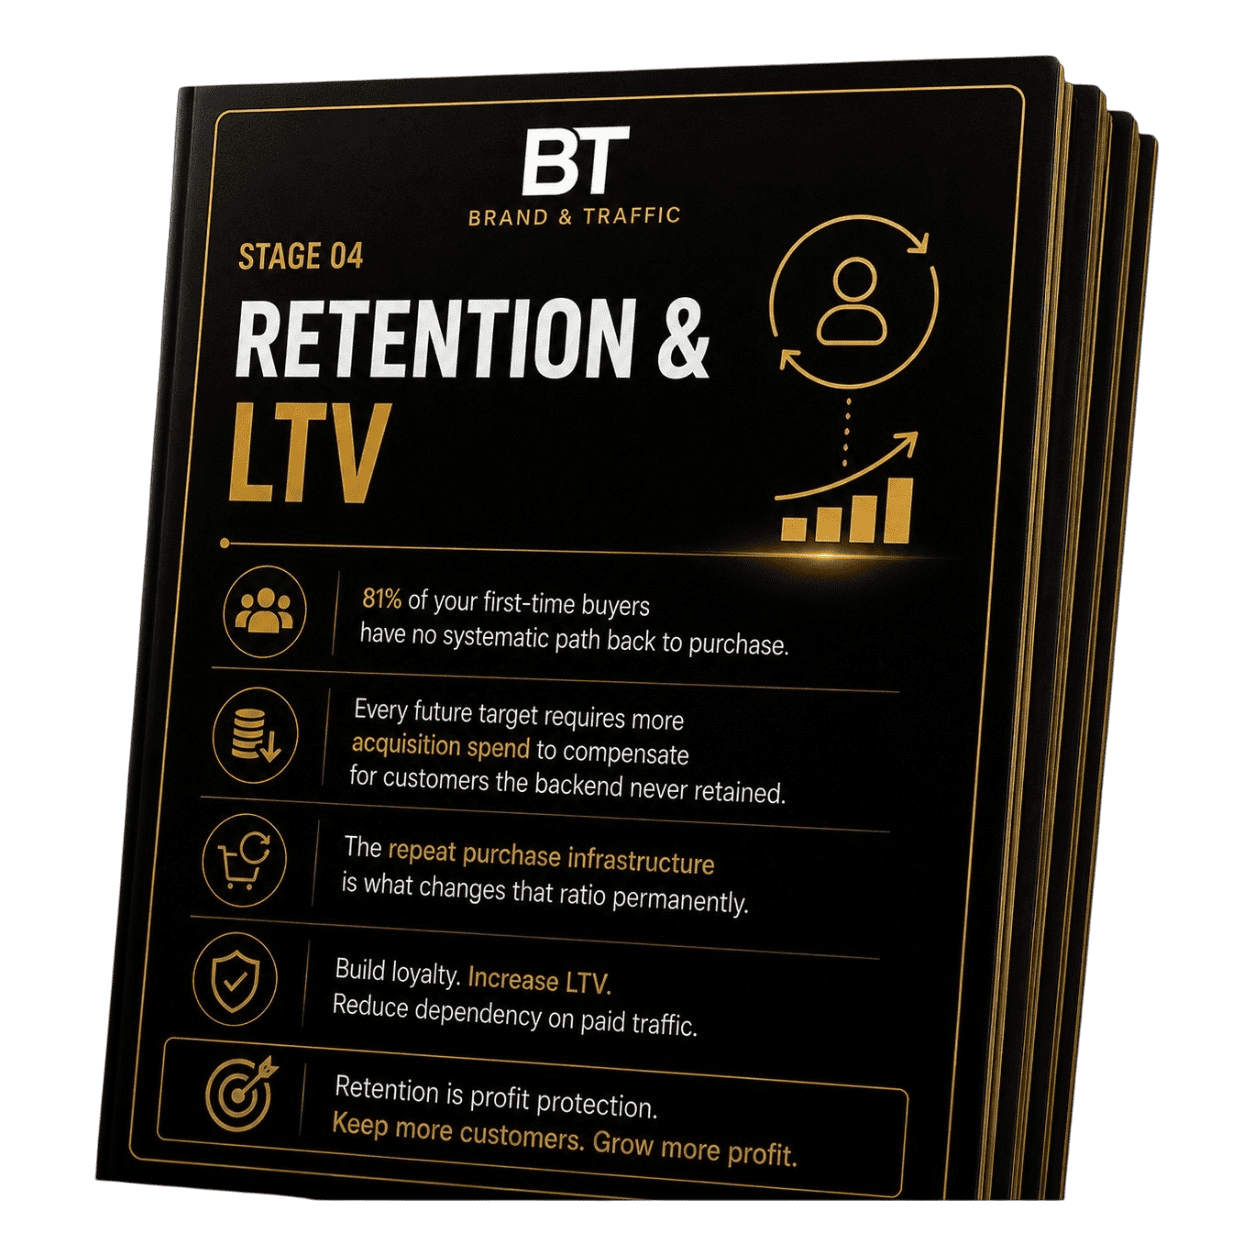
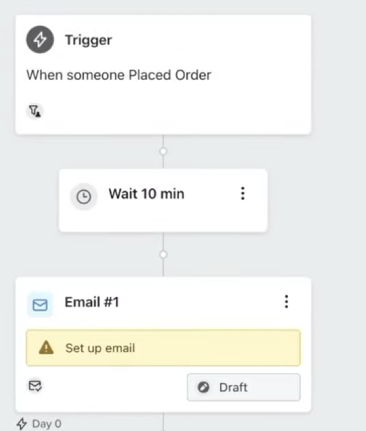
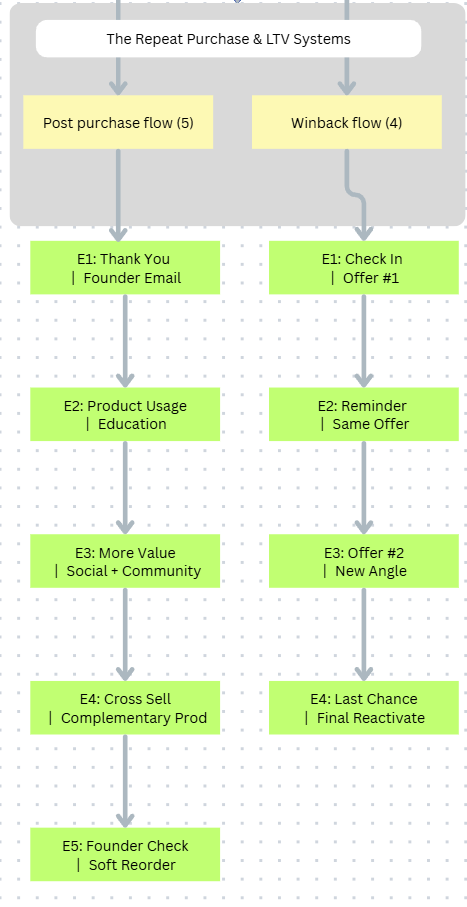
Post-purchase flow. Win-back flow. Nine emails in total.
The first flow reduces buyer's remorse, builds trust, conditions customers to buy again.
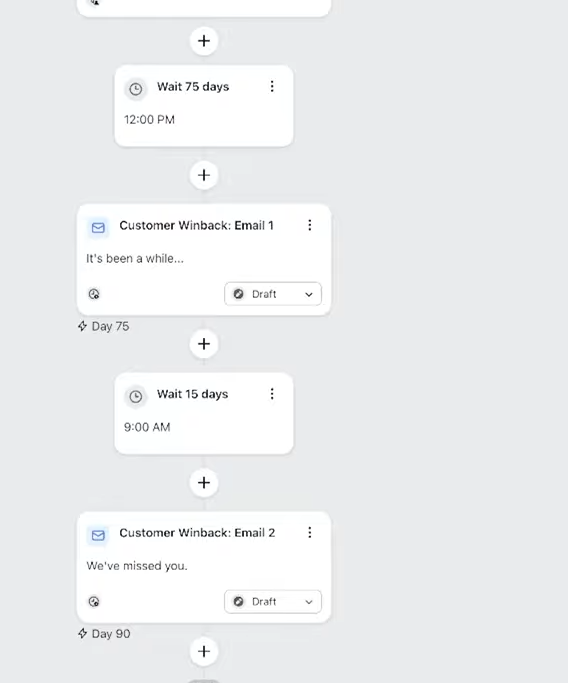
The second flow brings back customers who would've otherwise disappeared.
Convincing an existing customer to buy again is cheaper than convincing a new customer to buy once.
That's where profit is created.
Frontend. Middle. Backend. All connected.
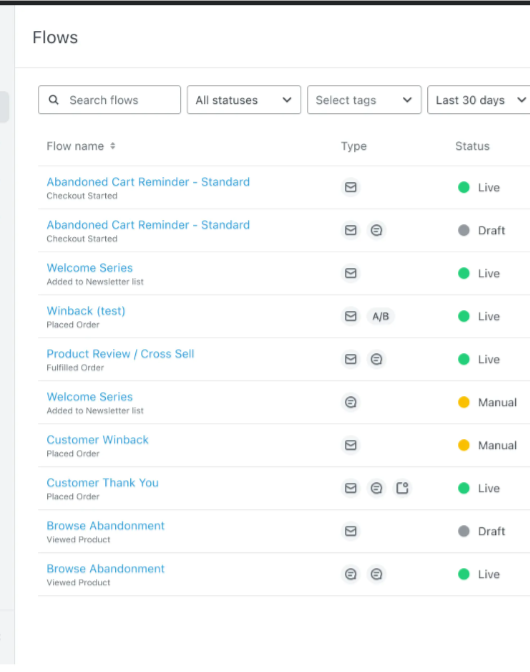
28–33 emails. 8 flows. Built into your brand once.
Ensures your emails consistently reach the inbox. Protects you from spam folders and disengaged subscribers. Keeps more of your list engaged and maximizes the value of every send.
Turns more of your existing website traffic into subscribers and customers, recovering revenue that would otherwise leave unnoticed.
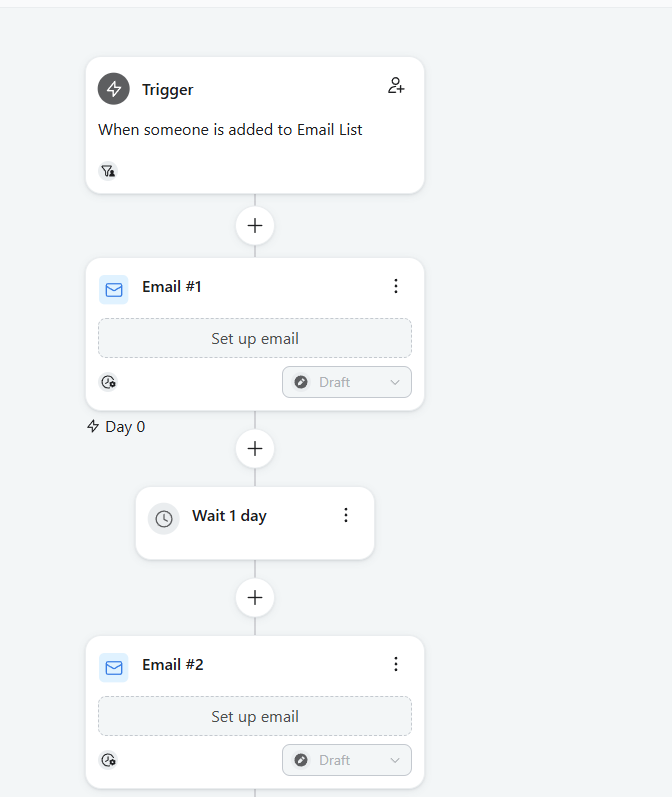
Strategy, flow logic, copy, design, subject lines, dynamic product integration, mobile optimization, QA, and launch. Built to convert new subscribers into first-time buyers by eliminating objections and establishing brand authority.
Identifies high-intent visitors who left without engaging and re-engages them before the interest window closes.
Triggers on product-level intent signals and re-engages visitors before they reach cold traffic status.
Multi-touch recovery with behavioral logic, objection handling, and urgency architecture. Typically the highest single-flow ROI in any lifecycle build.
Captures the highest-intent drop-off point in the purchase journey. These are customers who had their card out. Recovery rate consistently outperforms all other abandonment flows.
Reduces buyer's remorse, drives review generation, introduces cross-sell, builds brand trust, and seeds the next purchase trigger. The difference between a one-time buyer and a retained customer starts here.
Identifies customers at risk of permanent churn and re-engages them before they exit the active database. Includes behavioral segmentation logic, time-delay architecture, and re-engagement copy.
Identifies fully inactive subscribers and makes a final re-engagement attempt before suppressing them. Includes inactivity-based segmentation, suppression logic, and last-chance reactivation messaging.
The 3-Month Campaign Calendar
Delivered with the build.
Most ecommerce brands run campaigns reactively — deciding what to send one or two weeks before a revenue window, under deadline pressure, with no message architecture behind it. The result is discount-heavy blasts that compress margin, inconsistent brand voice, and missed commercial windows that don't come back.
This is the opposite of that.
Delivered alongside the build — 36–48 campaign briefs across 3 months, built around your product category, customer lifecycle stage, and your commercial calendar. Non-discount frameworks built throughout.
What each campaign includes
· Campaign angle and messaging strategy
· Subject line and preview text
· Hook and headline
· Body copy direction
· CTA copy
· Offer messaging where applicable
· Design direction — concept, layout brief, and visual hierarchy so your designer or VA can implement it in your exact brand style without rework
What's mapped across 3 months
· Non-discount campaign frameworks built in throughout — so the calendar generates revenue without being dependent on promotions to drive sends
· Campaign angles calibrated to your specific customer lifecycle — not generic seasonal templates lifted across clients
On design direction vs. design files: Every campaign includes a full design direction brief so your team executes it in your brand's exact style. Final design files are not included.
Every business is different. But the gap is always calculable.
We actually built a configurable calculator for this.
Because every business is different. Some brands are leaving SGD 330,000 on the table over 12 months. Others significantly more.
| Category | Conservative | Average | Best Case |
|---|---|---|---|
| Deliverability & Segmentation | SGD 30,000 | SGD 48,000 | SGD 72,000 |
| Traffic-to-Revenue Capture | SGD 48,000 | SGD 96,000 | SGD 156,000 |
| Revenue Recovery | SGD 120,000 | SGD 264,000 | SGD 480,000 |
| Retention & LTV | SGD 132,000 | SGD 348,000 | SGD 588,000 |
| Total — All 4 Categories cumulative across 12 months | SGD 330,000 | SGD 756,000 | SGD 1,296,000 |
We'll build the system into your business. One-time. No retainers.
We'll build the system into your business.
One-time.
No retainers.
And if we don't outperform your old flows within 30 days…
You'll receive a full refund.
Every part built properly compounds the next.
Every part built properly compounds the next.
If you'd like to see where your bottlenecks are — book a call below.
We'll walk through your frontend, middle, and backend.
Free · No pitch · No commitment · Findings yours to keep